
Mastering Support and Resistance: Key Pillars of Trading Strategy
Trading based on support and resistance levels involves viewing specific price points on a chart as barriers that may halt or reverse further price movements. Learn more about these levels and how they influence trading decisions in our comprehensive review.
Understanding Price Movement Levels
Support and resistance (S&R) levels are critical concepts in technical analysis across financial markets. These levels represent stable points where supply and demand dynamics typically interact, though these conditions can change rapidly.
Typically derived from historical price data, these levels are marked by prices that have repeatedly acted as turning points or barriers in the market. They are instrumental in technical analysis, providing quick insights into potential market directions and aiding decisions on when to enter or exit trades.
Understanding Support and Resistance Levels

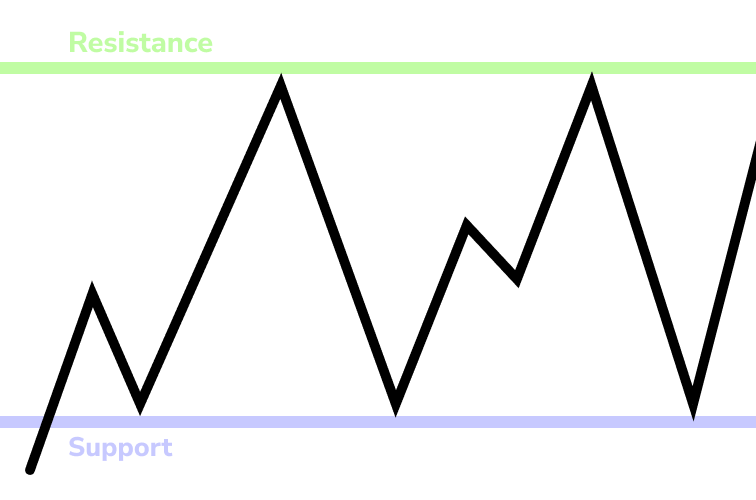
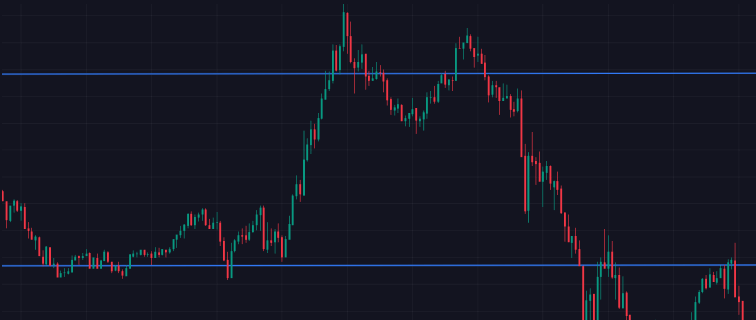
Support Level: This indicates where downward price movements tend to halt as demand becomes strong enough to prevent further declines. When prices approach this level, there is a higher probability of a rebound rather than a breakthrough to lower levels. However, it’s also possible for prices to break through support levels, continuing their descent to the next support zone.
Resistance Level: Conversely, this marks a ceiling where upward price movements may stall due to significant selling pressure. Upon reaching this level, prices often retreat rather than breaking through immediately. Yet, like support levels, resistance can also be breached, allowing prices to extend their upward trajectory until encountering the next resistance barrier.
Visualizing this concept, imagine a ball bouncing between a floor (support level) and a ceiling (resistance level) within a room. Similarly, trading instruments oscillate between these zones, attempting to breach their boundaries to establish new price trends.


Fibonacci Support and Resistance Levels
Fibonacci levels, despite not aligning with specific historical data of any asset’s support and resistance, are universally applicable across various charts, making them a valuable tool in trading strategies.
These levels derive from a numerical series attributed to Leonardo of Pisa, known as Fibonacci (circa 1170 – circa 1250), a prominent medieval European mathematician. The sequence follows a simple rule where each number is the sum of the two preceding numbers. This sequence yields ratios like approximately 0.618 when dividing consecutive numbers, and around 0.382 for other divisions. The inverse of these ratios yields approximately 1.618, historically termed the “Golden Ratio,” utilized since Euclid’s “Elements” (circa 300 BC) for constructing an ideal pentagon.
In financial analysis, the search for this golden ratio on stock market charts is credited to R. N. Elliott (1871-1948), an American engineer and founder of wave theory, underscoring its significance in market analysis.
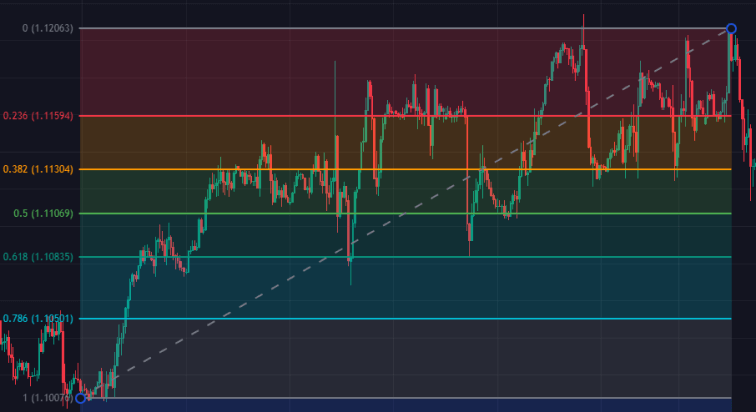
The Fibonacci tool comprises levels such as 0, 23.6, 38.2, 50, 61.8, and 161.8, reflecting the mathematical sequence. The 161.8 level, synonymous with the golden ratio, often signals potential peak movement before a correction. Traders typically use levels like 38.2, 50, and 61.8 to enter the market. In trending markets, 61.8 serves as a primary entry point due to its potential to bypass lower levels, while in horizontal markets, 38.2 or 50 levels are preferred.
However, it’s crucial to note that Fibonacci levels are most effective in trending markets. In the absence of a clear trend, traders may need to wait for clearer signals. Additionally, while Fibonacci levels enhance trading strategies, they should complement rather than replace comprehensive market analysis.
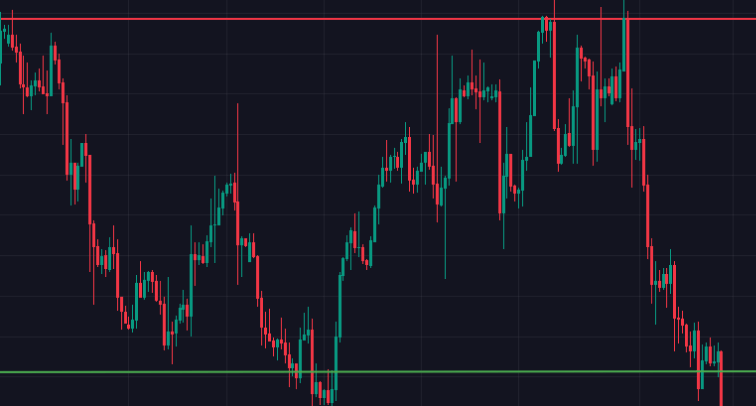
Support and Resistance Zones: Enhancing Trading Strategies
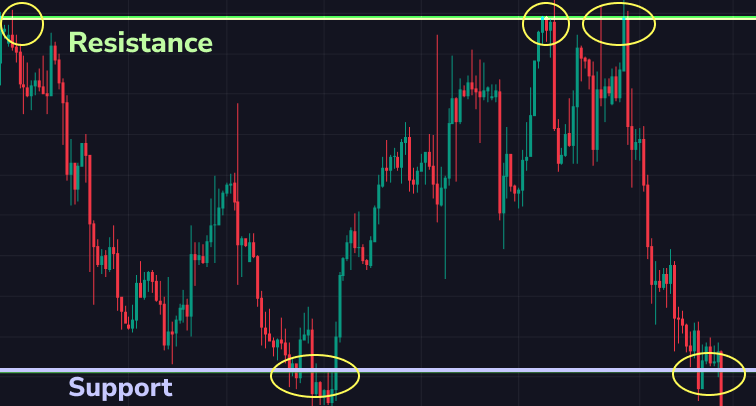
Support and resistance zones encompass broader areas than singular levels, identified through analysis of historical price data, chart patterns, or technical indicators. Support zones typically align near previous lows, while resistance zones cluster around prior highs. Recognizing these zones aids traders in pinpointing potential entry and exit points.


Integration with Other Indicators
Trading within support and resistance zones often involves combining multiple technical indicators to enhance forecasting accuracy and decision-making:
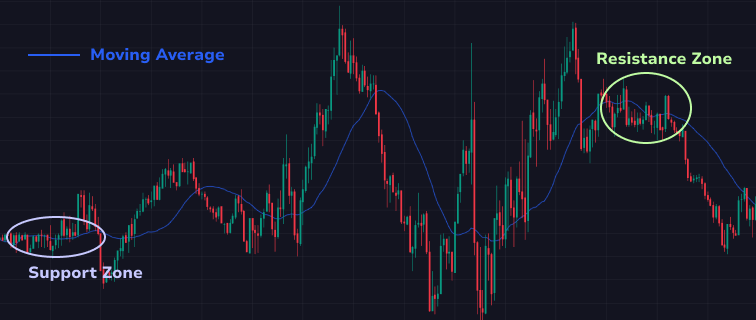
1. Moving Averages (MA).
Moving averages smooth price data and indicate trend directions. Prices near a support zone, coinciding with a long-term moving average (e.g., 200-day SMA), reinforce the zone’s significance. Similarly, a resistance zone aligned with a long moving average suggests robust resistance. Traders analyze these interactions to validate support and resistance levels.
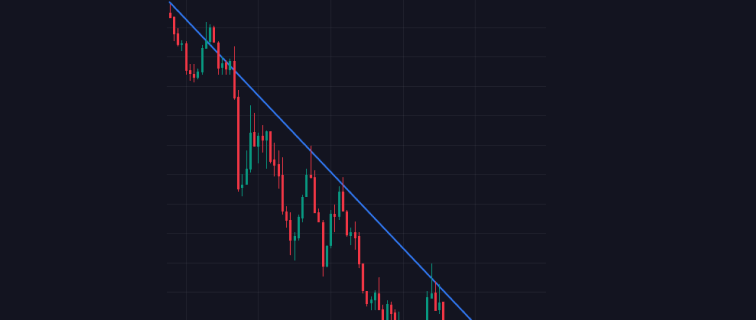
2. Trend Lines.
These lines connect successive highs or lows, revealing price trends. A support zone intersecting with an ascending trend line signals a potential buying opportunity, while a resistance zone intersecting with a descending trend line may indicate a selling opportunity. Trend line crossings within support and resistance zones help predict potential trend reversals.
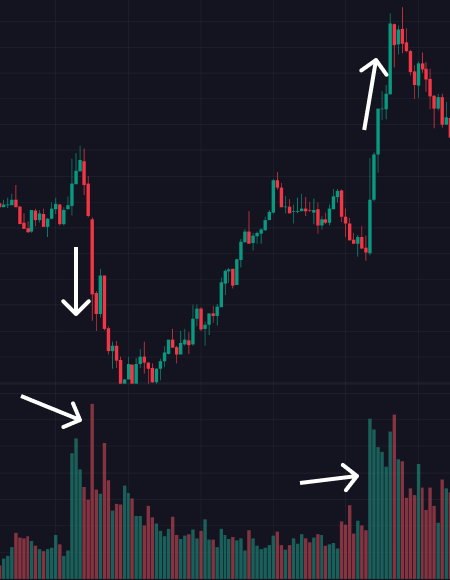
3. Volume Analysis.
Volume measures trading activity over time, indicating price movement strength. Spikes in volume at support levels suggest active buying, reinforcing the zone’s importance. Conversely, spikes at resistance levels indicate active selling. High volume at these zones confirms their significance as key market levels.
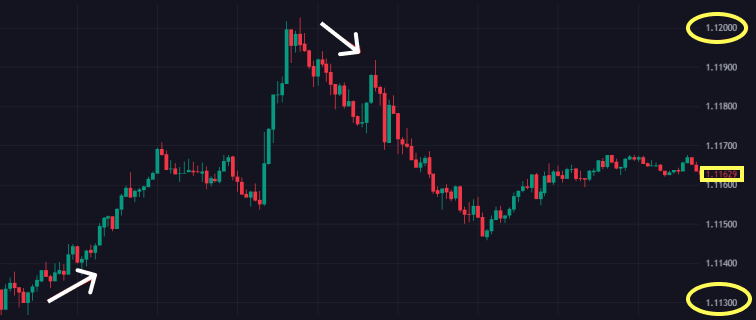
4. Round Numbers.
Psychological barriers like round numbers often influence trader behavior. Support and resistance zones near round numbers can be particularly robust due to psychological factors, affecting trading activity. Traders observe round numbers alongside other indicators to validate support and resistance zones.
5. Fibonacci Retracements.
These levels identify potential support and resistance based on Fibonacci ratios (e.g., 38.2%, 50%, 61.8%). Support zones coinciding with these levels often trigger strong buy signals, while resistance zones suggest sell signals. Integrating Fibonacci levels with support and resistance zones helps identify crucial market pivot points.
By combining support and resistance zones with various technical indicators, traders obtain more reliable signals for informed decision-making. Each indicator complements the others, increasing the likelihood of accurately identifying market movements and minimizing trading risks.
Utilizing Support and Resistance Levels in Trading
Understanding how to effectively apply support and resistance levels in trading involves employing four primary strategies:
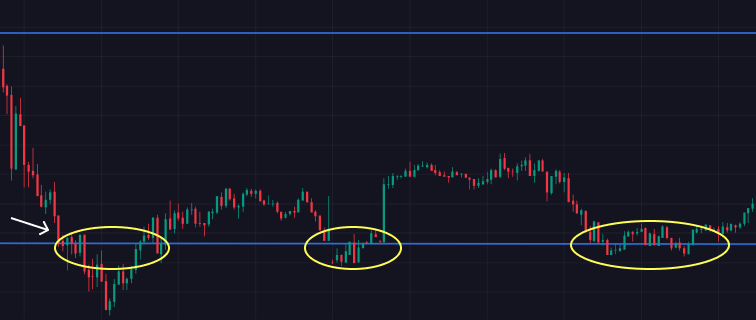
1. Range Trading.
Range trading occurs within the boundaries set by support and resistance lines. Traders typically buy near the support level and sell near the resistance level. It’s crucial to note that these levels aren’t exact prices but rather zones where price movements tend to react. Traders identify these zones to establish long positions when prices bounce off support and short positions near resistance. To manage risk, stop losses are often placed below support for long positions and above resistance for short positions.
2. Breakout Trading.
Breakout trading involves capitalizing on price movements beyond support or resistance levels after a period of consolidation. Traders aim to enter positions as prices break below support or above resistance, anticipating continued momentum in the breakout direction. Assessing the likelihood of a breakout requires evaluating multiple indicators to confirm market sentiment.
3. Trend Line Trading.
This strategy utilizes trend lines drawn across successive highs or lows to identify support or resistance. In an uptrend, traders draw a line connecting lows; in a downtrend, highs are connected. Strong trends see prices bouncing off these trend lines, signaling potential entry points in the direction of the trend. Traders may also employ scalping or countertrend strategies based on short-term deviations from the trend.
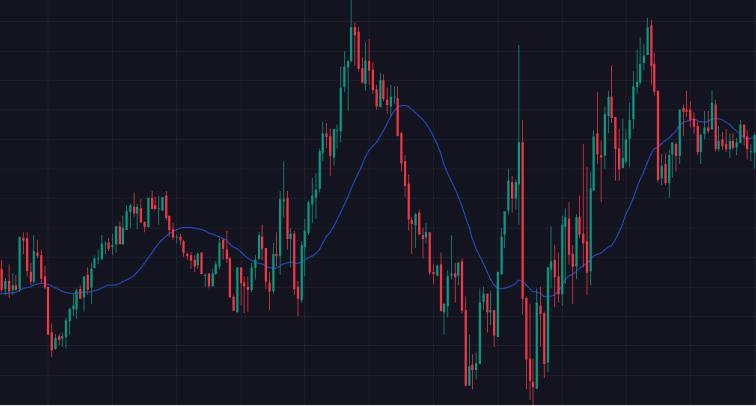
4. Moving Average (MA) Trading.
Moving averages serve as dynamic support and resistance levels. Popular choices include the 20-period and 50-period moving averages, although adjustments like 21 and 55 periods, aligned with Fibonacci numbers, are also utilized. Traders observe how prices interact with these moving averages to gauge momentum and potential reversals, using crossovers and price interactions to inform trading decisions.
Each strategy involves integrating support and resistance concepts with other technical indicators to enhance trading precision and manage risk effectively. By understanding these strategies, traders can navigate varying market conditions with greater confidence and strategic insight.
This version provides a detailed exploration of how support and resistance levels are applied in trading across different strategies, emphasizing the importance of integrating these concepts with other technical tools for informed decision-making.
The Importance of Support and Resistance in Trading
Support and resistance levels are fundamental concepts in technical analysis, serving as cornerstones for a variety of analytical tools. Identifying these levels allows traders to gauge critical price points that influence asset movements.
Determining future support levels provides traders with insights into price levels likely to sustain an asset’s value, offering strategic entry points for buying. Conversely, anticipating resistance levels helps traders anticipate price ceilings that may hinder upward movements, influencing decisions to sell or manage long positions.
Various methods exist for identifying support and resistance levels, but their interpretation remains consistent: these indicators forecast potential price movements, aiding traders in predicting asset behavior and pinpointing optimal buy and sell opportunities.
Instead of a conclusion
The value of support and resistance lies in their ability to highlight critical areas where market psychology may shift, often due to increased trading activity. When prices approach these levels, traders pay close attention as they can signal potential reversals or continuations of the prevailing trend. This dynamic creates opportunities for strategic trades, allowing traders to capitalize on these pivotal moments.
However, it’s essential to acknowledge that while support and resistance strategies are valuable, they are not foolproof. Market conditions can be unpredictable, and prices may break through these levels despite historical trends. Therefore, relying solely on support and resistance can be risky.
Successful trading demands a comprehensive approach that includes thorough research, careful analysis, and prudent risk management. Traders should use support and resistance in conjunction with other technical indicators and market data to create a well-rounded trading strategy. This might include analyzing volume spikes, trend lines, moving averages, and other relevant indicators to confirm signals and improve the accuracy of predictions.
In summary, support and resistance are fundamental tools in technical analysis that can significantly enhance a trader’s ability to make informed decisions. While they offer valuable insights into market behavior, they should be part of a broader, well-researched strategy that considers various factors and employs robust risk management practices to safeguard investments.